Claude vs ChatGPT for Charts, Diagrams & Visualizations: Which One Should You Use in 2026?
TL;DR
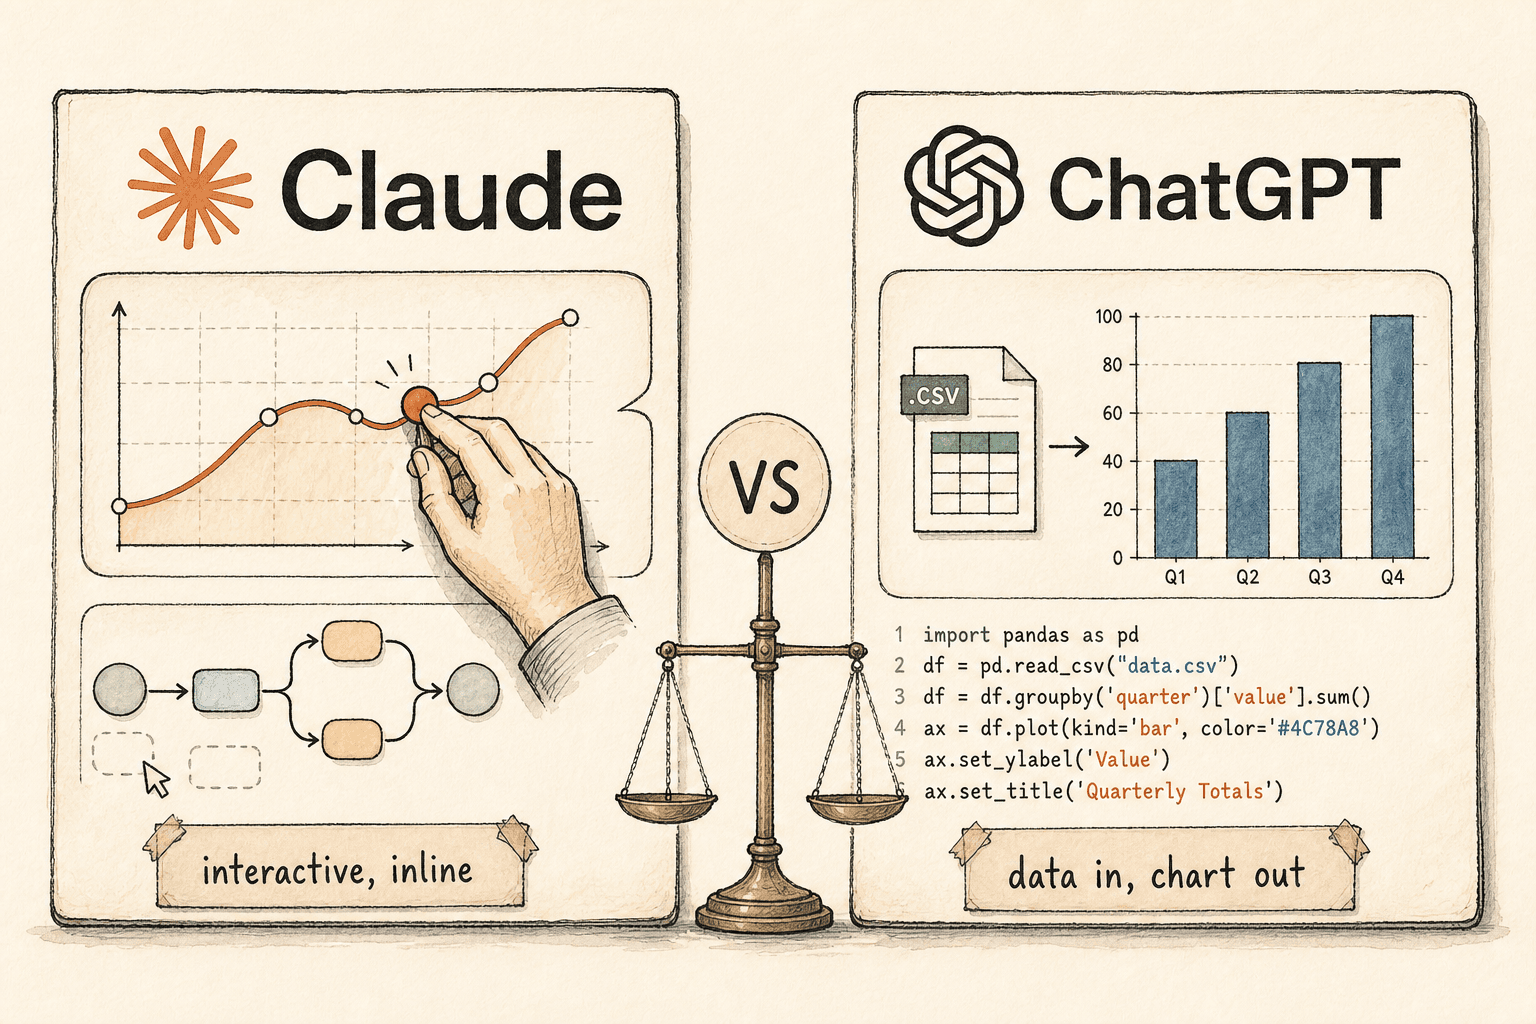
- Pick ChatGPT when you upload a real dataset and need a precise, reproducible, downloadable chart with the analysis code shown — it runs Python (pandas/matplotlib) over your files and returns static charts plus interactive bar, line, pie and scatter views.
- Pick Claude when you want a visual you can poke at and iterate on mid-conversation, or a shareable interactive tool — it renders charts and diagrams as live code inline and turns the keepers into downloadable, MCP-connectable Artifacts.
- The one rule: ChatGPT is the data-cruncher (start from a file, end with a chart and the code); Claude is the explainer and builder (start from an idea, end with something interactive you can manipulate or ship). Both are on free tiers, with different limits.
"Can AI just make me the chart?" Both Claude and ChatGPT now say yes — and then do something completely different. That difference is the whole decision, and most head-to-head takes miss it because they test "make a bar chart of this" and call it a tie.
It isn't a tie. ChatGPT approaches a visual as a data problem: give it a file, it writes and runs code, it returns an artefact you can download. Claude approaches a visual as a thinking-and-building problem: describe an idea, it renders something interactive you can adjust as the conversation moves, and ship as a reusable tool if it's worth keeping. Pick the wrong one for the job and you'll fight it the whole way — so here's what each actually does, which plans you need, and the single rule for choosing which to open.
The short answer: which should you use?
Use ChatGPT when the visual comes from data you already have, and use Claude when the visual comes from an idea you want to explore or a tool you want to keep. That one distinction resolves most cases before you look at a single feature.
| If your job is… | Use | Because |
|---|---|---|
| Turn an uploaded spreadsheet/CSV into a precise, downloadable chart | ChatGPT | Runs Python over your data, shows the code, exports a clean static chart |
| Reproduce the same chart reliably with the numbers behind it | ChatGPT | Code-backed output is auditable and repeatable |
| Explain a concept with a visual you can click and adjust | Claude | Renders an interactive visualization inline, iterates in chat |
| Build a reusable interactive tool, dashboard or diagram to share | Claude | Artifacts are shareable, downloadable and can connect to live data |
| Crunch a large dataset that lives in Google Sheets | Gemini (runner-up) | Sheets-native editable charts that regenerate on data change |
Everything below is the detail behind that table.
How Claude builds visuals
Claude's default move is to render a visual as live code directly inside the chat. As of March 2026, Claude can "create custom charts, diagrams and other visualizations in-line in its responses — and then tweak and modify its creations as the conversation develops," with the feature on by default. Anthropic's examples are telling: an interactive compound-interest curve you can drag, and a clickable periodic table — visuals built to be manipulated, not just looked at.
These belong to a category worth naming: the inline interactive visualization — a temporary, in-chat visual that Claude renders as code and updates as the conversation evolves. Anthropic is explicit that these are distinct from Artifacts, which are "permanent tools and documents created by Claude, designed to be shared or downloaded as more polished work." The inline visuals "are temporary — they change or disappear as the conversation evolves." So Claude gives you two tiers: throwaway visuals for thinking, and Artifacts for keeping.
Artifacts are where Claude gets durable. They cover documents, single-page HTML, SVG images, diagrams and flowcharts (rendered from Mermaid text), and interactive React components — all viewable as code, copyable, downloadable and versioned. On Pro, Max, Team and Enterprise plans, Artifacts can connect to external services through the Model Context Protocol, turning a chart into an interactive app that reads and writes to tools like Asana, Google Calendar and Slack. In Claude Cowork, "live artifacts" go further — persistent, interactive HTML dashboards that refresh with current data from connected apps — though for now they're paid-plan, Desktop-only, local and not yet shareable.
Two things to keep straight. The inline-visuals feature is available on all plan types, including free. And separately, Claude can also interact directly with apps like Figma, Canva and Slack within conversations — that's an adjacent capability, not part of the inline-visuals feature itself.
How ChatGPT builds visuals
ChatGPT's default move is to treat a visual as the output of a data-analysis job. Upload a file and "ChatGPT can analyze uploaded files… and create tables or charts," and "for some data-analysis tasks, ChatGPT writes and runs Python code in a stateful Jupyter notebook environment." That Python sandbox — pandas and matplotlib under the hood — is the engine, and it's a genuine strength: you get the chart and you can see the code that produced it, which makes the result reproducible and auditable.
The interactivity is narrower than Claude's, and worth knowing precisely. ChatGPT "can create static charts as image outputs," and "some charts can also be shown as interactive charts" via a "Switch to interactive chart" toggle — but that interactive mode "is supported for bar, line, pie, and scatter charts," with other types "returned as static images." So the default is a static image; interactivity is an opt-in for four chart types.
The data side has hard edges. Supported files include .xls/.xlsx/.csv, PDF, and json/xml/yaml/txt/md, with a 512MB per-file ceiling, roughly 50MB for CSVs and spreadsheets, and 2M tokens for documents. The analysis sandbox "cannot make external web requests or API calls" — it works on what you give it. And free users are limited to 3 file uploads per day, so heavy data work is effectively a paid-tier feature.
ChatGPT has two more relevant surfaces. Canvas is a side-by-side editor that renders React and HTML in a sandbox (npm packages and many JS libraries work), so it can produce live interactive output much like a Claude Artifact — the difference is that Canvas is a mode you invoke, where Claude renders inline by default. And ChatGPT's native image generation can produce diagrams and infographics as raster images with strong text rendering — useful for a polished illustration, but the result is a picture, not editable chart code.
Claude vs ChatGPT: the side-by-side
The clean way to compare them is by how the visual is produced, how interactive it is, and what you walk away with.
| Dimension | Claude | ChatGPT |
|---|---|---|
| Default output | Interactive visual rendered as live code, inline | Static chart image from a Python (pandas/matplotlib) job |
| Interactivity | High — drag, click, iterate in chat by default | Opt-in toggle, bar/line/pie/scatter only; else static |
| Best input | An idea or concept to visualise | An uploaded dataset to analyse |
| Diagrams | Mermaid / SVG / React (editable code) | Raster image via image generation (not editable) |
| Data ceiling | Works from description; data via connectors/MCP | 512MB/file, ~50MB CSV, 2M tokens; no web/API in sandbox |
| Reusable output | Artifacts: shareable, downloadable, MCP-connectable; Cowork live dashboards | Canvas: live React/HTML render (a mode you invoke); downloadable chart files |
| Shows the code | Yes (Artifacts) | Yes (the Python it runs) |
| Free tier | Inline visuals + Artifacts on all plans | 4o-style image gen + Canvas on free; data uploads capped at 3/day |
| Plan names | Free, Pro, Max, Team, Enterprise | Free, Plus, Pro, Team, Enterprise, Edu |
Where ChatGPT wins
ChatGPT wins decisively when the visual has to come out of a real dataset and be trusted. The workflow it's built for is "here's my 40,000-row sales CSV — give me the chart and the numbers behind it." Because it runs actual Python over your file and shows the code, the output is reproducible, auditable and exportable as a clean static asset — exactly what you want for a report, a board deck or anything where someone will ask "how was this calculated?" Claude's live-render strength is the wrong tool for that job.
The honest runner-up here is Google Gemini, if your data already lives in a spreadsheet. Gemini in Google Sheets produces "fully editable charts that regenerate if the spreadsheet data changes," which is the most frictionless path when the source of truth is a Sheet — though its performance is "most consistent in files below 1 million cells" and it needs a paid Workspace or Google AI tier.
Where Claude wins
Claude wins when the visual is for thinking, explaining or building rather than reporting. Ask it to show how a neural network forward-pass works and you get a clickable diagram you can step through; ask it to model a scenario and you get a curve you drag to change assumptions — all rendered inline and refined as you talk, with no mode-switch and no file required. That iterate-in-place loop is the thing ChatGPT's data-analysis flow doesn't natively do.
It also wins on durability and distribution. A Claude Artifact isn't a screenshot — it's a shareable, downloadable, versioned interactive component that can connect to live tools through MCP, and in Cowork can become a refreshing dashboard. If the output's job is to be used again by other people, Claude's the one that produces an object, not an image.
The one scenario where the loser wins
The fastest way to pick wrong is to assume the tool you prefer is the tool for the job — so here's the crossover in both directions.
When the data-cruncher should step aside: if you have no dataset and just want an interactive teaching widget from a description — "make me a clickable diagram of how DNS resolution works that I can walk through" — ChatGPT's strength is irrelevant and Claude's inline, manipulable, iterate-in-chat visual is the better fit.
When the visual tool should step aside: if you have a 30MB CSV and need a publication-ready static chart with the pandas code shown for review, Claude's live interactive render is the wrong output and ChatGPT's Python sandbox plus clean static export wins. Reach for Gemini instead only if that data already lives in a Google Sheet.
What about Gemini, Canva and the rest?
Beyond the two majors, the field splits by where your work already lives. Google Gemini is the spreadsheet-native option — strongest when the data is in Sheets and you want charts that regenerate on change. Canva is the design-led option, best when the goal is a highly polished marketing infographic rather than data accuracy. Napkin AI specialises in turning existing text into diagrams and flowcharts. And Mermaid — the open-source, text-to-diagram syntax that Claude's Artifacts use under the hood — is worth knowing if you want diagram-as-code you fully control. None of these displaces the core choice: dataset-in, chart-out is ChatGPT; idea-in, interactive-thing-out is Claude.
Authoritative sources & related reading
- "Claude now creates interactive charts, diagrams and visualizations" (Anthropic, March 2026) — the source announcement for Claude's inline interactive visuals.
- Claude Help Center: "Artifacts" and "Live artifacts in Cowork" — output types, plan availability and MCP connectivity.
- OpenAI Help Center: "Data analysis with ChatGPT", "File uploads FAQ" and "Canvas" — the Python sandbox, chart interactivity, file limits and Canvas rendering.
- Google Workspace: "Fully editable charts with Gemini in Google Sheets" (June 2025) — the spreadsheet-native comparison point.
- AI Heroes: Harness Debt: Your AI Agent Scaffolding Is Quietly Fighting the Model — why the model is usually more capable than the tool around it.
- AI Heroes: Claude Code HTML Output: An Implementation Guide — turning Claude's rendered output into production assets.
- AI Heroes: Claude for Small Business: 2026 Implementation Guide — picking the right AI tool for the actual job.
Frequently Asked Questions

Founder, AI Heroes
I build AI companies and the systems inside them. At AI Heroes, we give businesses the functional capacity to grow without the headcount growth normally demands — sales that follows up, marketing that runs, content that ships, ops that handles itself. We audit where you're leaving growth on the table, build the team that captures it, and hand it over completely.
I've built at scale before. Leading product and GTM at SlideSpeak AI (1M+ monthly users, profitable, bootstrapped). CPO at Disperse — the AI construction platform that went from 3 to 200+ people on $35M raised. I also co-founded LOBOMAR, a luxury fashion label featured in Elle, Cosmopolitan, and the LA Times, with shows at the London Design Museum, Wereldmuseum, and Amsterdam Fashion Week.
Related Articles

What Is Claude Tag? How Anthropic's Slack AI Teammate Works (2026)
Anthropic launched Claude Tag on 23 June 2026: a way to work with Claude inside Slack as a shared, always-on teammate. Tag @Claude and it plans a task, uses the tools you grant it, and replies in-thread. It is multiplayer, learns from the channel, can take initiative, and works asynchronously over hours or days. It runs on Opus 4.8, is in beta for Enterprise and Team, and replaces the old Claude in Slack app.
How to Get Started with Claude Cowork: A Decision Framework for Knowledge Workers (2026)
Claude Cowork is where you delegate a whole task instead of asking a question — point it at your files and apps, describe the outcome, get finished work. The hard part isn't the prompt, it's knowing which tasks to hand it. Here's a 5-signal fit test, the three shapes a Cowork task can take, and how to get your first deliverable in ten minutes.

How Claude Managed Agents Actually Work: Dreaming, Outcomes, Multiagent Orchestration, and Webhooks (2026)
Anthropic gave Claude Managed Agents four new mechanics at Code w/ Claude: Dreaming, Outcomes, Multiagent Orchestration, and Webhooks. The one that changes how you build is Outcomes — a separate grader that loops the agent until a rubric is met. Here is how each one works, and when to reach for it.