Charts

1 article

Handdrawn editorial split-screen comparison: left card shows Claude (Anthropic wordmark + symbol legible) rendering an interactive curve and a clickable diagram inline in a chat bubble; right card shows ChatGPT (OpenAI wordmark + symbol legible) outputting a static bar chart with visible Python code beside an uploaded spreadsheet; a central balance/decision element between them; calm cream background, pen-and-watercolour style
AI ToolsClaude vs ChatGPTClaude

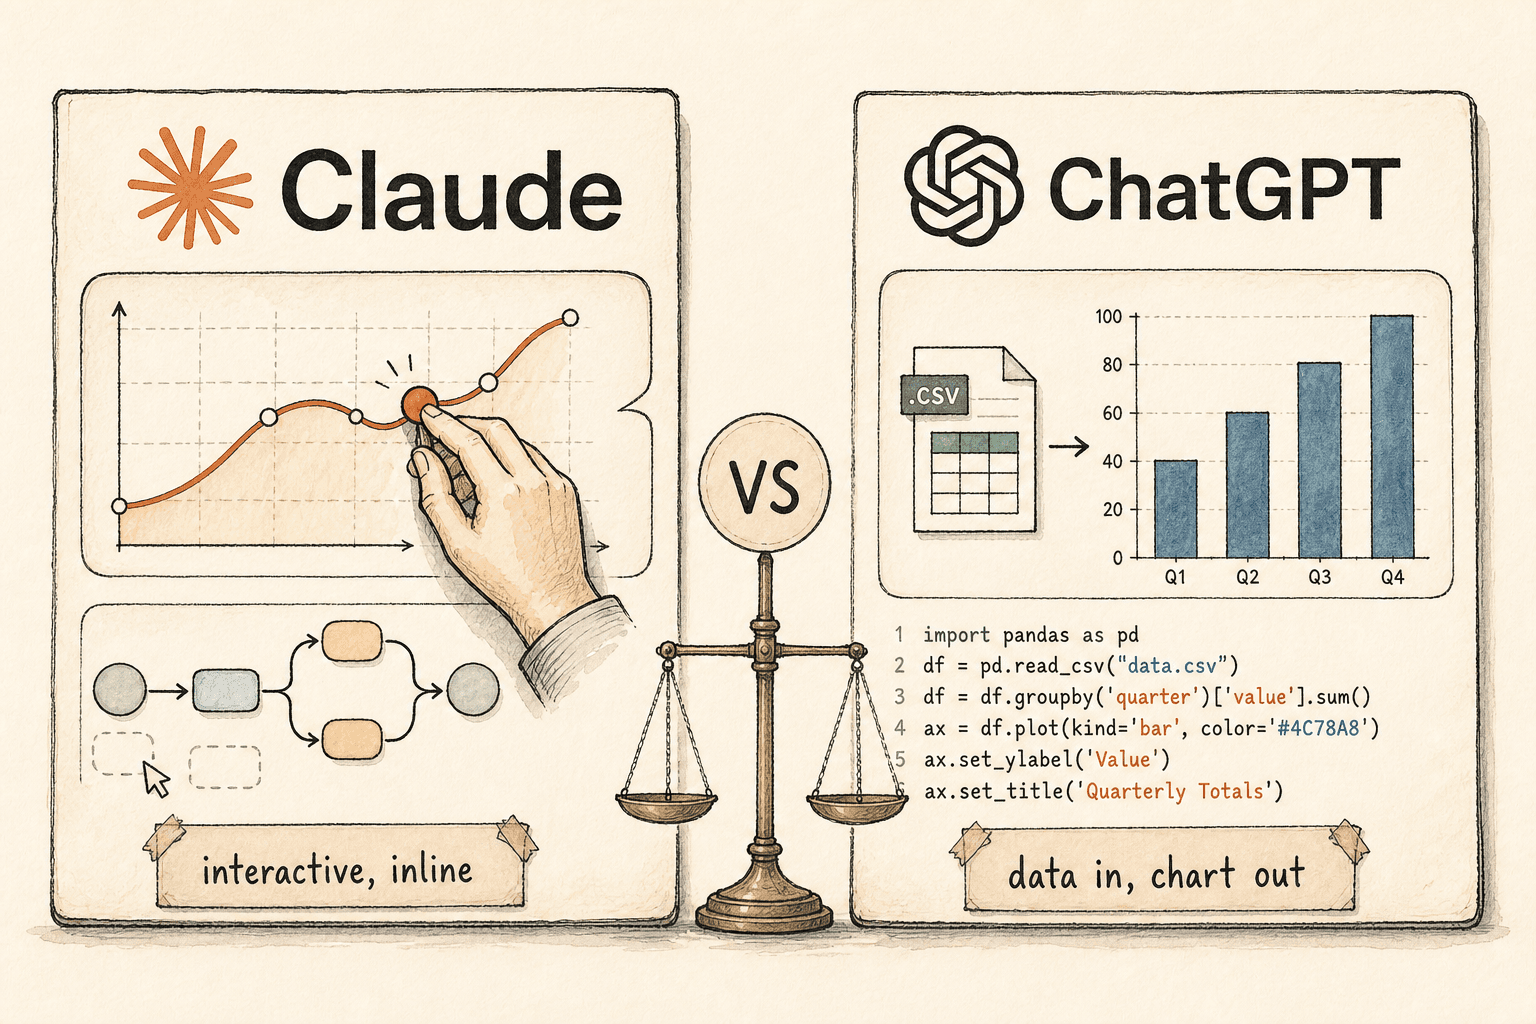
Claude vs ChatGPT for Charts, Diagrams & Visualizations: Which One Should You Use in 2026?

Upload a dataset and need a precise, downloadable chart with the code shown? That's ChatGPT. Want a visual you can poke at, iterate on in conversation, or ship as a shareable interactive tool? That's Claude. The full comparison — capabilities, plans, and where each one quietly loses.

Marco Lobo
Marco Lobo·23 May 2026·11 min read